A financial projection in Excel is an essential tool for any entrepreneur, small business, or project that needs to plan growth, anticipate risks, and make decisions based on real data.
In this guide, you’ll learn how to create a financial projection in Excel, what elements it must include, and how to use a ready-to-download financial projection template Excel designed to project revenue, expenses, and cash flow over 12–24 months.
Below you’ll find a complete, practical, and SEO-optimized article designed for entrepreneurs who want clarity and control over their finances.
Download the Free Financial Projection Template Excel
Financial Projection Excel by Stuguía
What Is a Financial Projection in Excel?
A financial projection is an estimate of your future revenue, expenses, net cash flow, and liquidity. It helps you determine whether your business will be profitable, how much capital you’ll need, and how your month-to-month cash flow will behave.
Doing it in Excel is ideal because it lets you automate calculations, apply advanced formulas, and visualize results through professional charts—without needing extra software.
Benefits of Using a Financial Projection Template Excel
Using a financial projection template Excel gives you advantages such as:
- Automation: Avoid manual errors and save time.
- Dynamic scenarios: Simulate growth, budget cuts, or new investments.
- Visualization: Charts that show monthly and annual financial evolution.
- Better decision-making: Analyze the financial health of your business.
You can also adapt the template to any industry: services, e-commerce, consulting, restaurants, freelancing, and more.
How to Create a Financial Projection in Excel (Step by Step)
Below is a clear guide to help you build a financial projection from scratch—or fully understand the downloadable template.
1. Set Your Base Revenue
Define how much your business is making today.
In Excel, record your current monthly revenue and the expected growth rate. For example:
- Base monthly revenue: $25,000
- Monthly growth: 4%
The formulas in the financial projection template Excel will automatically calculate revenue projections for up to 24 months using compound growth.
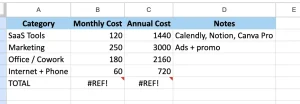
2. Enter Your Operating Expenses
Include costs such as:
- Rent
- Utilities
- Payroll
- Marketing
- Production
- Subscriptions
In the template, expenses are projected with similar formulas:
Base monthly expenses + estimated monthly growth
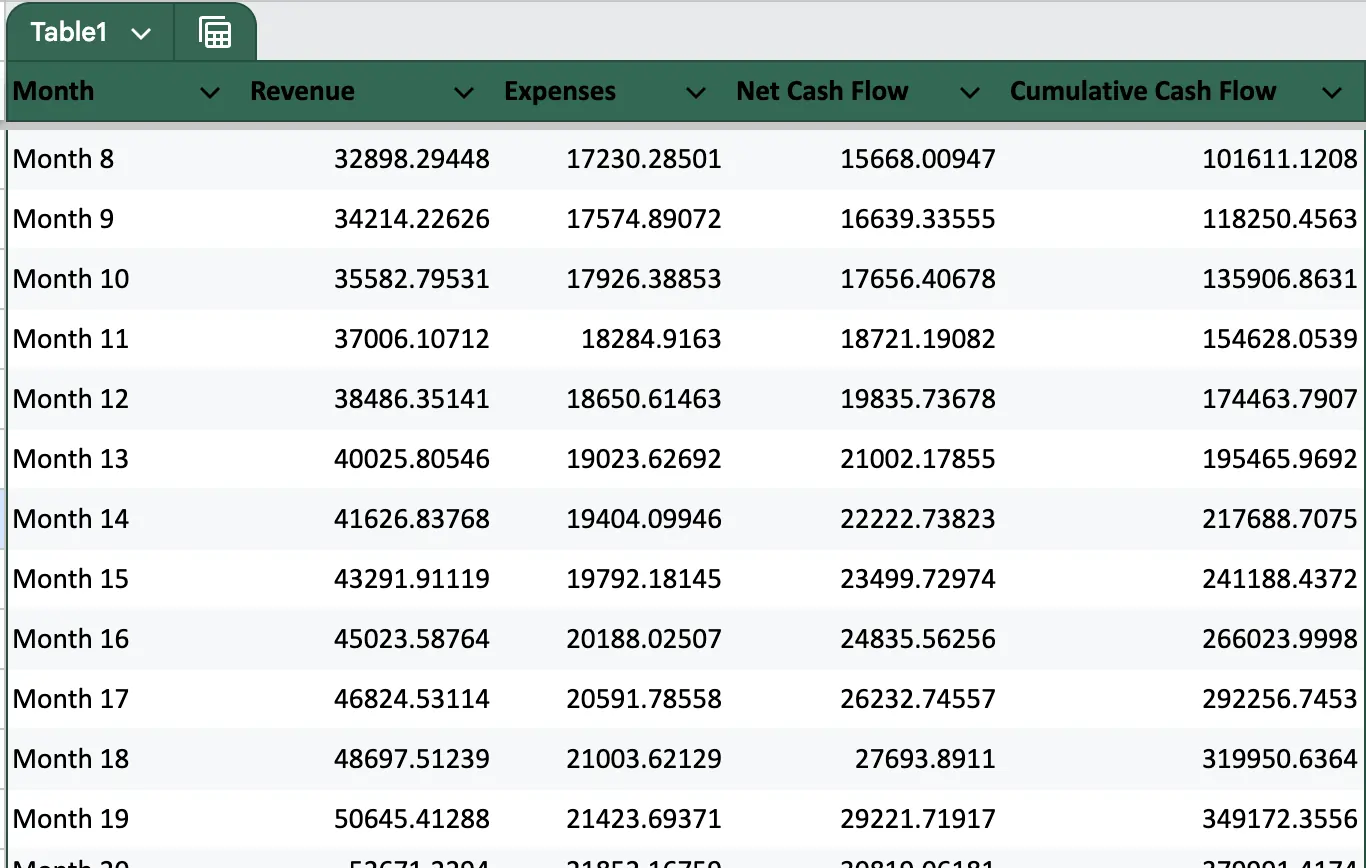
3. Calculate Net Cash Flow
Net cash flow is the difference between revenue and expenses:
Net Cash Flow = Revenue – Expenses
This metric shows whether your business is generating money or losing it during a given period.
4. Calculate Cumulative Cash Flow
Cumulative cash flow shows how your liquidity evolves over time.
Cumulative Month N = Previous Month’s Cumulative + Net Cash Flow Month N
This is essential to determine whether you’ll need additional funding or can run operations with your own resources.
5. Create Charts to Visualize Your Results
The financial projection template Excel includes charts such as:
- Revenue vs. Expenses (line chart)
- Monthly Net Cash Flow (bar chart)
- 24-Month Financial Overview
These visuals help you easily identify trends, critical months, and periods of higher profitability.
Download the Financial Projection Template Excel
The template included with this article was designed for entrepreneurs seeking a clean, professional, and fully automated Excel file. It includes:
✔ Editable input fields
✔ Automatic 12–24 month projections
✔ Net and cumulative cash flow
✔ Line and bar charts
✔ A ready-to-use financial dashboard
You can download it directly and start customizing it within minutes.
Tips to Improve Your Financial Projection
- Update your data monthly: Keep your projections aligned with reality.
- Simulate multiple scenarios: Create pessimistic, realistic, and optimistic versions.
- Control fixed expenses: Small changes compound significantly over time.
- Calculate your break-even point: Determine how much you must sell to avoid losses.
- Monitor cumulative cash flow: Avoid negative months that may put your operations at risk.
FAQ: Financial Projection Template Excel
1. What is a financial projection in Excel?
It’s an estimate of a business’s future financial performance using formulas, calculations, and charts inside Excel. It allows you to visualize revenue, expenses, and cash flow.
2. How do I create a financial projection in Excel?
Define your base revenue, monthly expenses, and expected growth percentages. Then apply compound growth formulas and net cash flow calculations. This guide explains each step, and you can use the included financial projection template Excel to speed up the process.
3. What does the financial projection template Excel include?
It includes a professional dashboard, 24-month automatic projections, net and cumulative cash flow calculations, and dynamic charts.
4. What is a financial projection used for?
To plan the financial future of your business, anticipate liquidity problems, evaluate investments, prepare for bank financing, and make better strategic decisions.
5. Is it useful for entrepreneurs?
Yes. It’s one of the most important tools for new and growing businesses because it shows whether the business model is sustainable and how much investment you need.

I’m a freelance writer specializing in clear, useful, and inspiring content on health, wellness, personal finance, and entrepreneurship. I’m passionate about research, turning complex information into simple, actionable insights, and helping people make smarter decisions to improve their lives.
I write about healthy habits, nutrition, emotional well-being, money management, professional growth, and practical strategies for purpose-driven entrepreneurship.